MLB Pitching Velocity Keeps Climbing as Fastballs Average 95.3 mph
A faster baseline
Major League pitching has entered another gear. The average right-handed four-seam fastball reached 95.3 mph in 2026, while sliders averaged just under 88 mph and curveballs approached 81. Those figures describe league averages, not the limits of individual pitchers, but they show how much speed has become part of the ordinary pitching environment. The pace of the increase is striking: league velocity has climbed faster over the past two seasons, with no clear sign of a slowdown.
That distinction matters. A headline radar reading can make velocity sound like a contest among the hardest throwers, while an average captures a broader shift in what hitters face across a game. When the baseline rises, batters have less time to identify a pitch and decide whether to swing. The effect isn't identical for every hitter or every pitch, but speed changes the amount of time available for all the decisions that follow.
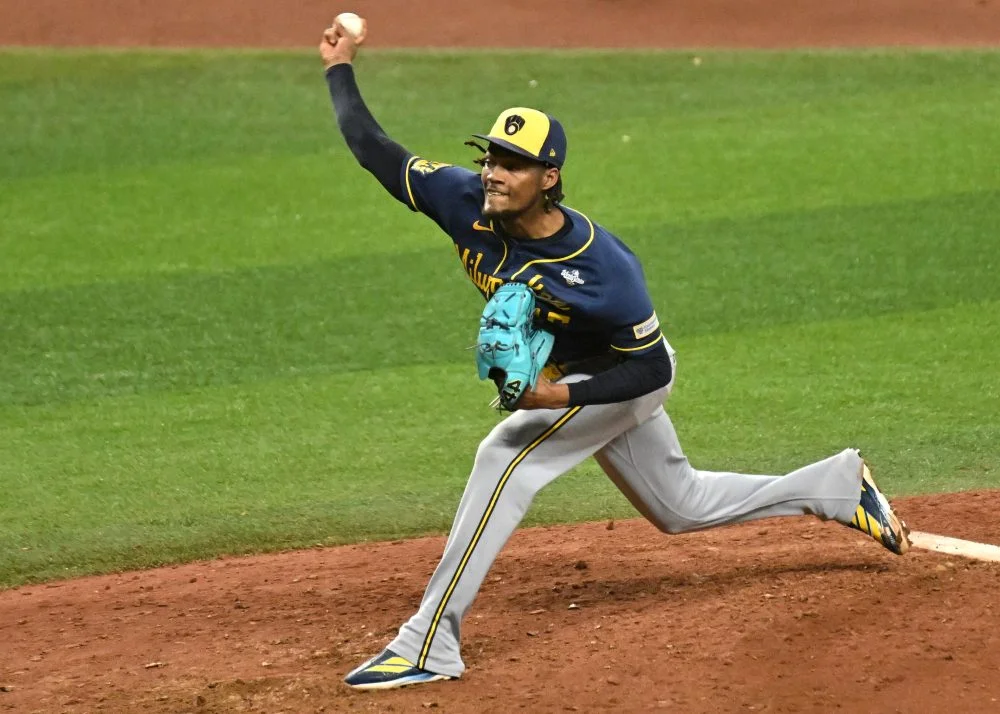
Image credit: IMAGN IMAGES via Reuters Connect. The image accompanies a story about league-wide velocity trends, a subject that can be difficult to see in a single play; the averages provide the broader frame.
Velocity’s uneven rise
Pitchers have thrown harder over the full span of reliably adjusted measurements, which date to 2008. But the climb hasn’t been steady. Velocity rose through the early and middle 2010s, then leveled off around 93 mph for much of the decade’s second half. After the shortened 2020 season, the trend turned sharply upward.
The shape of that line is as revealing as its direction. A steady, gradual increase would suggest one kind of change; a long pause followed by a sharper climb points to a game that may have crossed into a new phase. The available measurements establish the pattern, though they don't, by themselves, explain why it happened. That gap between observing a trend and explaining it is where simple stories about baseball's evolution often become too confident.
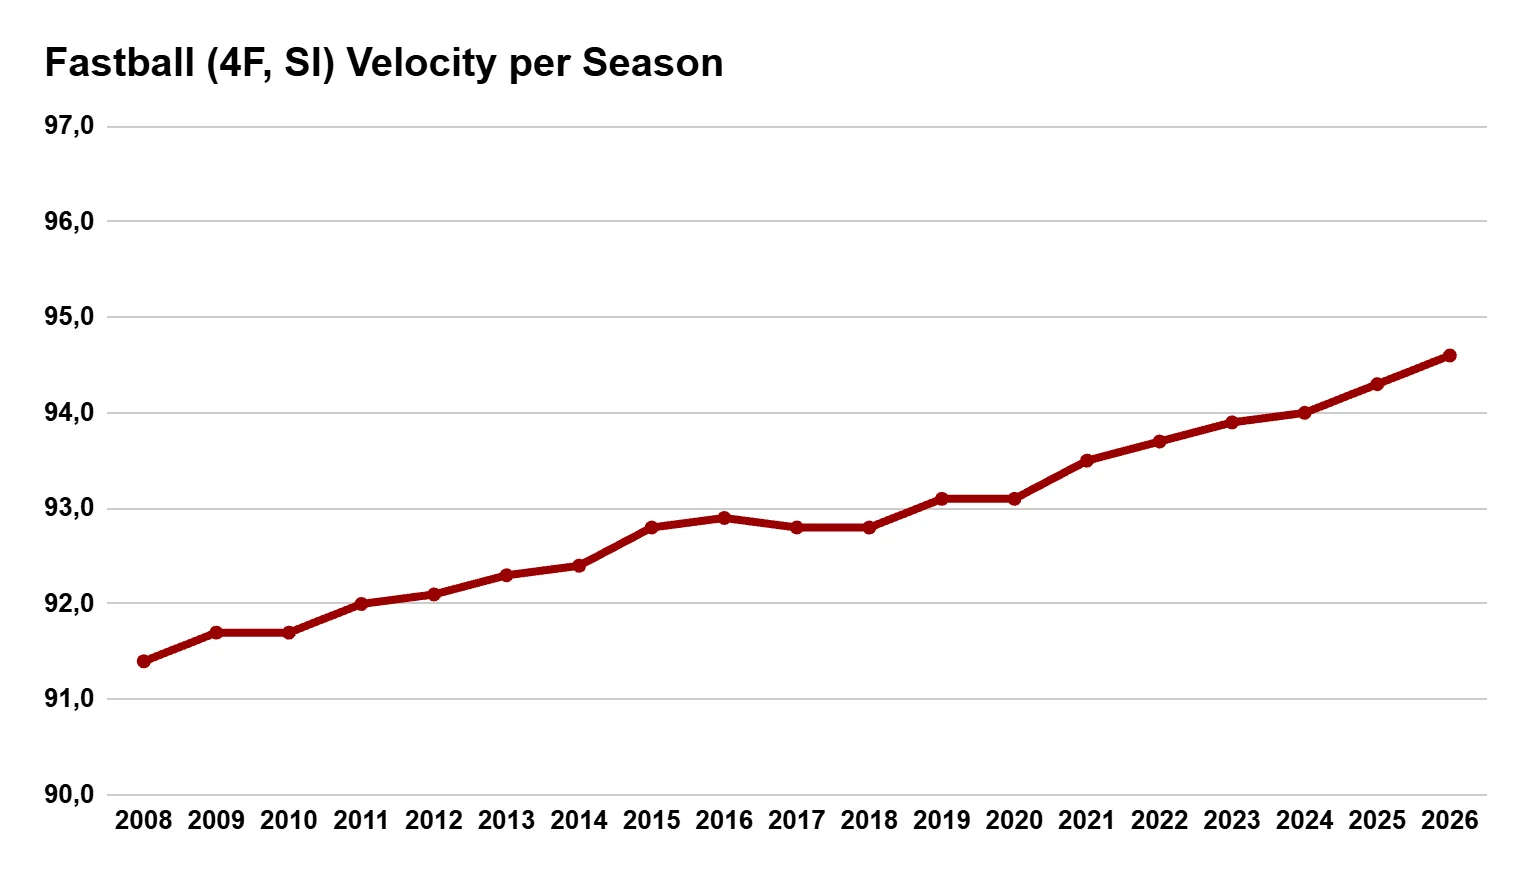
The earlier surge coincided with lower-scoring seasons, as deeper bullpens and richer data changed how teams deployed pitchers. The later stall overlapped with a steep drop in starting-pitcher usage and the juiced-ball era. Those timelines don’t establish cause and effect; they do show how much the game’s pitching environment shifted between 2009 and 2019.
That caution is useful because velocity doesn't change in isolation. Teams decide how to distribute innings, which pitchers face hitters more than once, and how to build a staff; those choices affect the kinds of pitchers who appear in the data. Similar changes in other sports often reflect several forces acting at once, and baseball's overlapping timelines leave room for more than one explanation. The figures tell us that the environment changed. They don't identify a single cause.
Pitch design meets raw speed
Teams have since advanced their understanding of spin and pitch physics, while refining pitch mixes with increasing precision. Velocity offers a clear measure of that development. The broader transformation of pitching over the last six or seven years may have outpaced the changes of the preceding three decades.
Speed is easy to record and compare, which helps make it the most visible sign of change. Pitch design is harder to reduce to one figure: a pitch's movement, release, and place in a sequence all affect what a hitter sees. More precise analysis can help teams think about those elements together, while higher velocity places additional demands on a hitter's ability to recognize and respond. Here's the thing: the fastball number is only one part of the problem confronting the batter.
And the gains aren’t limited to fastballs. Sliders are nearing 88 mph, and curveballs have moved past the once notable 80 mph threshold, approaching 81. That curveball mark was once sufficiently unusual to merit its own look at the 80 mph barrier.
The significance isn't simply that every pitch is getting faster at the same rate. Different pitch types serve different purposes, and the figures here describe average speeds rather than how a pitcher uses a pitch in a particular at-bat. Still, a faster breaking pitch can narrow the visual and timing contrast a hitter relies on when distinguishing one offering from another. A harder slider or curveball changes the context around the fastball, even when the pitcher's strategy can't be inferred from speed alone.
The cost of another tick
For anyone watching closely, the radar readings confirm what the game already shows: pitchers are producing force at levels that would once have seemed exceptional. This is more significant than it looks, because a rise in the average suggests that the change reaches beyond a small group of headline-grabbing throwers. The trend is a double-edged development. Greater velocity gives hitters less time to react, but it also raises questions about how far teams can push pitchers in pursuit of another fraction of a mile per hour.
That pressure is part of the story, even though the figures here don't measure its physical effects or establish what caused the increase. Pursuing speed involves choices about preparation, workload, and how pitchers are used. The available numbers can't tell us where the practical limit lies, or whether the recent pace will continue. They do make the question harder to ignore. (And this is the part most people overlook: the average can rise even while individual pitchers face very different demands.)
If you're working in this space, the useful comparison isn't just between one season and the next; it's between the recent acceleration and the periods when velocity slowed. That context makes a single new high less important than the shape of the trend around it. A fraction of a mile per hour may look small on a chart. Across a full league, repeated across pitches and seasons, it can signal a meaningful change in the conditions hitters face.
The useful signal now is the pace of change. A long plateau gave way to a rapid rise, and the latest seasons have accelerated it. If that pattern holds, the next benchmark in pitching may arrive sooner than teams and hitters expect. For the moment, the record is clear about the direction of travel, but less clear about the forces behind it or how long they can keep pushing in the same direction. Fast. And still climbing.